Braun and Clarke Thematic Analysis - How to do the six-step process in your qualitative research project
Braun and Clarke’s Reflexive Thematic Analysis catches more people out than you might think. In the twenty years I’ve spent supporting qualitative researchers, I’ve seen that happen repeatedly. To explain why, let me begin with a story.
Recently, I ordered a bookcase for the corner of our living room. It looked straightforward enough online. It seemed that putting it together would involve a calm hour with some basic tools, a cup of tea, and a podcast playing in the background.
Then the boxes arrived. Inside were boards, bags of fittings, mysterious brackets, instructions that looked relatively simple and several stages that only made sense after I’d already done them incorrectly once (okay, twice).
I backtracked, undid things, rebuilt sections, questioned my judgement. At one point I was too far in to give up, but nowhere near having a bookcase.
When it was finally assembled, it looked excellent.
What it did not reveal was the chaos involved in getting there.
Braun and Clarke’s thematic analysis often feels rather similar.
On paper, the six-step process can look neat, logical, and sequential. Many PhD researchers assume they simply need to follow the stages and a polished analysis will emerge. If that doesn’t happen, they assume it’s because they’ve got it wrong. Not true.
In practice, the work is more iterative than that. You revisit earlier decisions, rethink themes, question interpretations, and occasionally wonder whether everyone else understands this better than you do.
In the two decades I’ve spent supporting qualitative researchers, that moment comes up repeatedly.
They say things such as:
I understand the six stages, but I’m not sure what I’m actually doing inside them.
My themes feel more like summaries.
I’ve coded loads of data and now I don’t know what comes next.
I can’t tell whether this is analysis or description.
If any of that feels familiar, you are in good company.
This blogpost will walk you through Braun and Clarke’s six-step thematic analysis process in a practical way, using a simple example study on remote working during the COVID-19 pandemic. I’ll also show you where the stages often feel straightforward, and where many researchers begin to wobble.
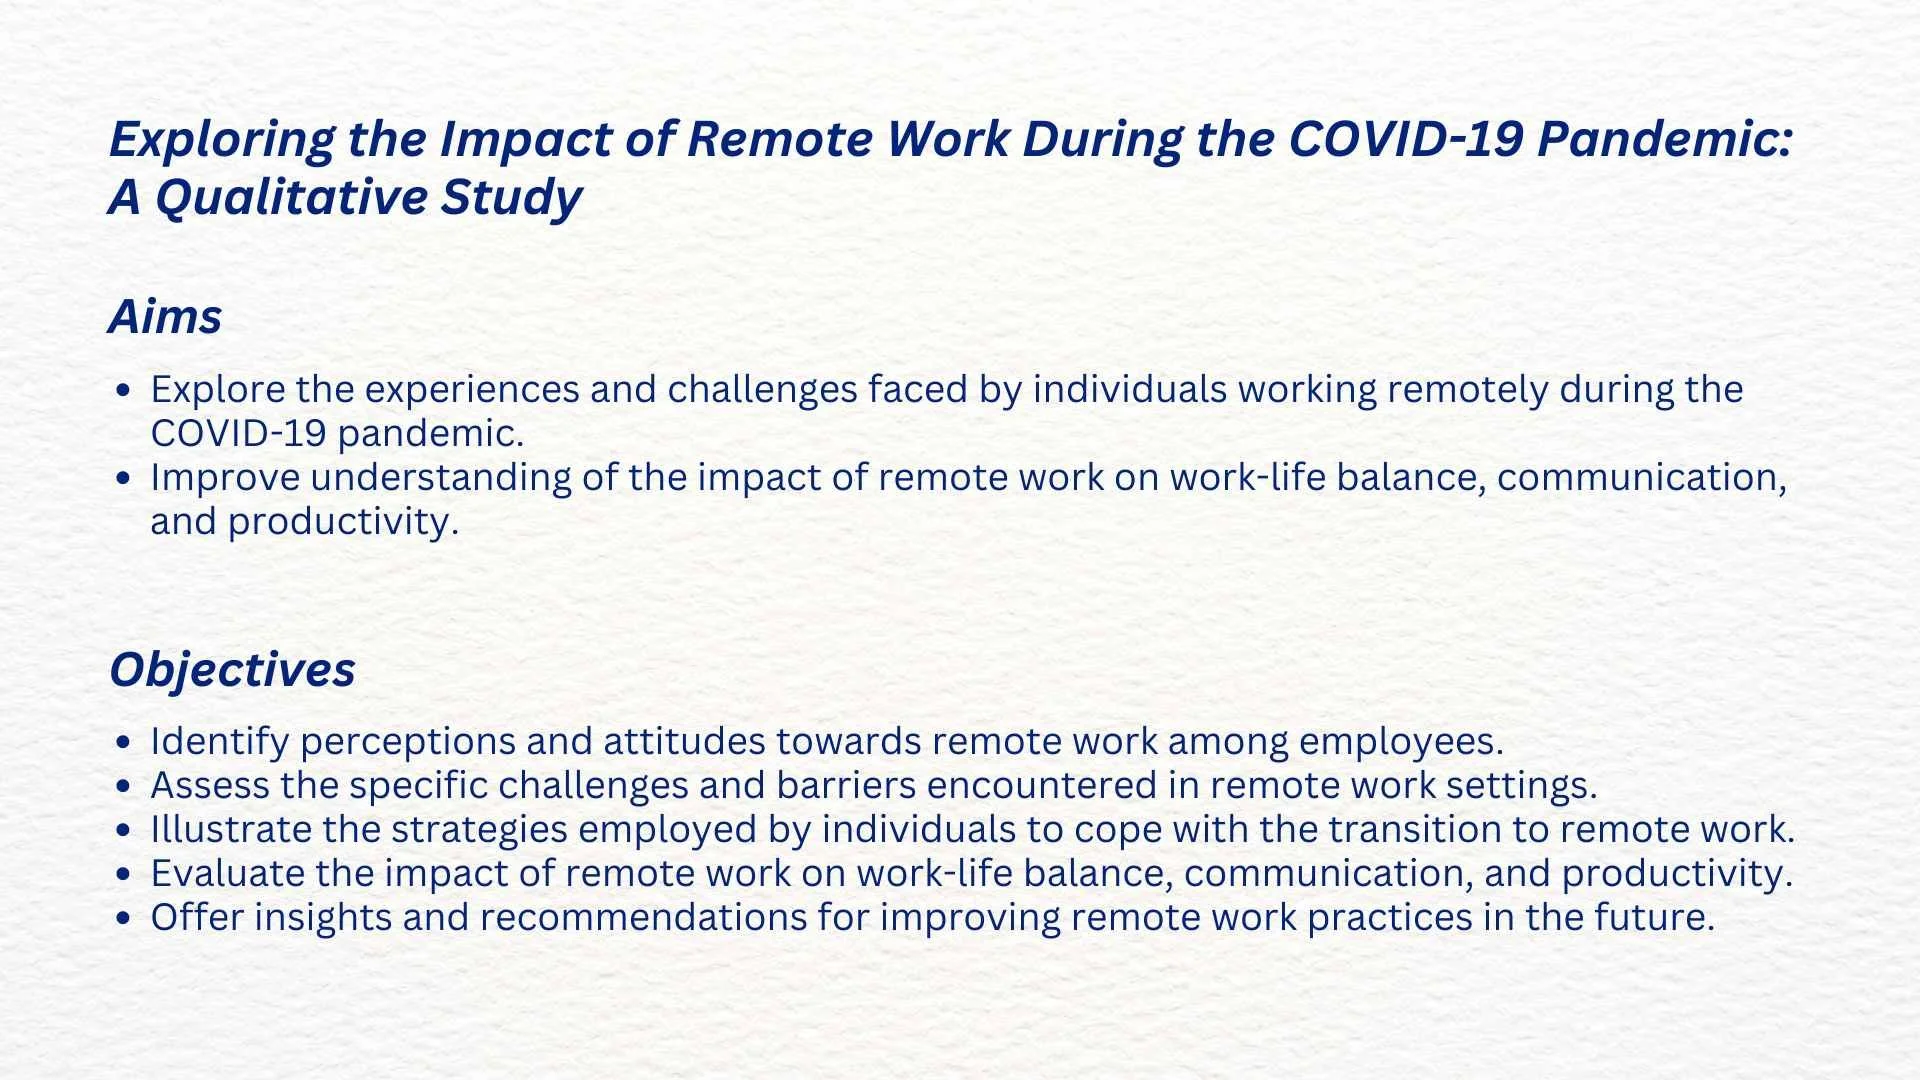
Our example study
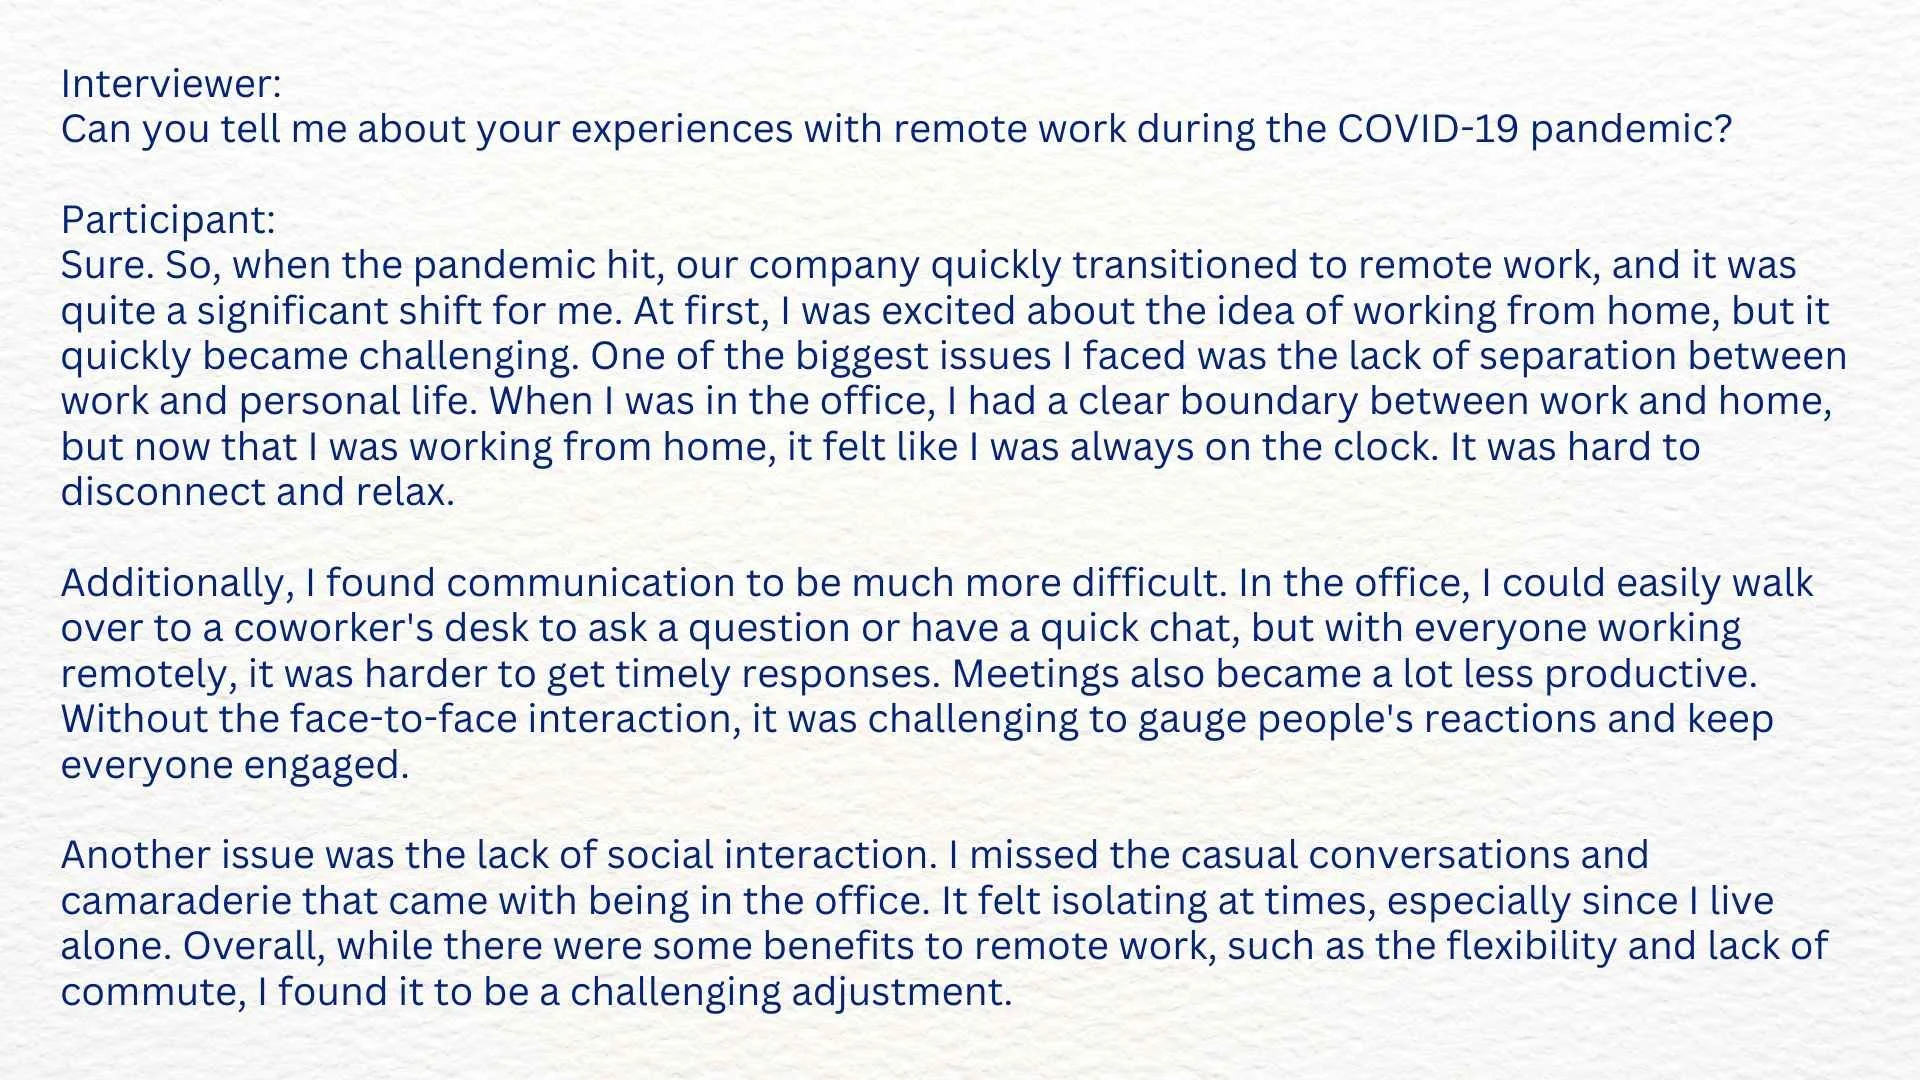
The example below shows a small qualitative project exploring experiences of remote work - aims, objectives, research questions and an extract from the data - we’ll use this throughout.

The six steps of Braun and Clarke’s Reflexive Thematic Analysis
Familiarising yourself with the data
Generating initial codes
Generating initial themes
Reviewing themes
Defining and naming themes
Writing up
(1) Familiarising yourself with the data
This stage sounds simple, which is partly why people underestimate it.
You are beginning to get to know your way around the data. It’s like going to a new coffee shop or restaurant for the first time and figuring out how to order and where things are. In this instance, that usually means reading transcripts, fieldnotes, documents, or notes more than once.
Simply reading – and not rushing to code immediately - can feel uncomfortable, particularly if you are someone who likes progress to look visible. Yet this slower early stage often saves time later.
You begin noticing recurring frustrations, emotional tones, contradictions, repeated phrases, what feels important beneath the surface, what might be going on in the background.
With the remote work example, you might notice people returning repeatedly to exhaustion, blurred boundaries, communication difficulties, and unexpected benefits.
At this point, you are not trying to finalise meaning - you are developing familiarity.
This is where a lot of people go wrong – they speed through the familiarisation stage because they’re impatient to get to the ‘important’ parts of coding and generating themes. I’d encourage you not to do that, because the longer you can patiently sit with your data and get to know it, the simpler those other processes will be. Weak analysis begins with hurried familiarisation, stronger analysis begins with calm, considered reading and reflection.
(2) Generating initial codes
Coding is often the first stage that feels tangible.
You move through the data line by line or section by section, identifying segments relevant to your research questions and assigning labels to them.
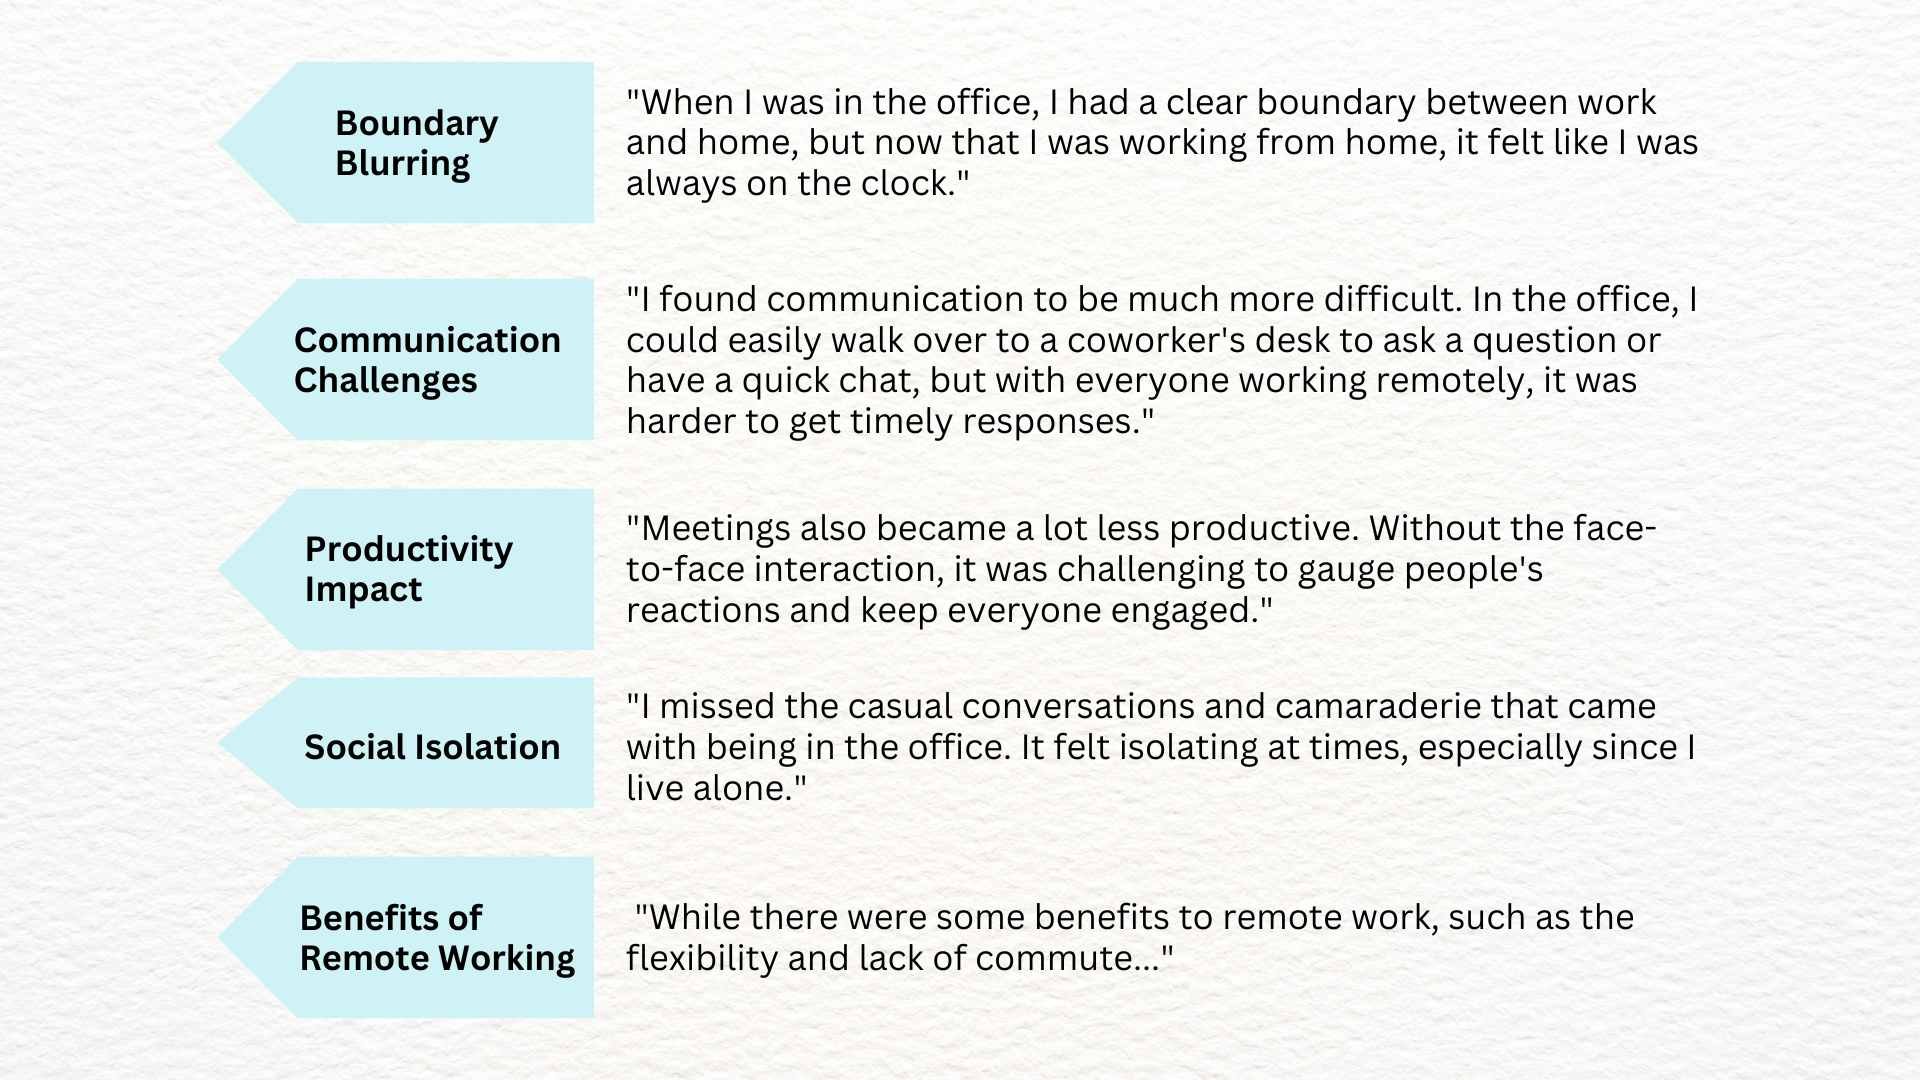
Codes in our example might include: boundary blurring, communication challenges, productivity impact, social isolation, and benefits of remote working.
Coding often brings relief because it feels like visible progress. You can point to what you’ve done. That matters, but coding is not the endpoint - it is the groundwork.
You are breaking data into meaningful pieces so you can later think across them.
Many researchers feel reasonably steady here, the uncertainty often arrives afterwards.
If coding has felt manageable but themes feel foggy, that is a very common pattern.
(3) Generating initial themes
This is where many PhD researchers begin doubting themselves.
Up to now, you have worked closely in the data. Now you need to step back and ask:
What do these codes begin to say collectively?
How do they connect?
What broader pattern of meaning might they reflect?
This is why Braun and Clarke use the word generate rather than discover.
Themes are not buried in the transcript like treasure waiting to be unearthed. They take shape through your engagement with the material, your research questions, and the interpretive decisions you make.
That can feel unsettling because judgement is now more visible.
You may think:
Who am I to say this is what the data means?
That feeling is common. It is often a sign that you have moved into real analysis.
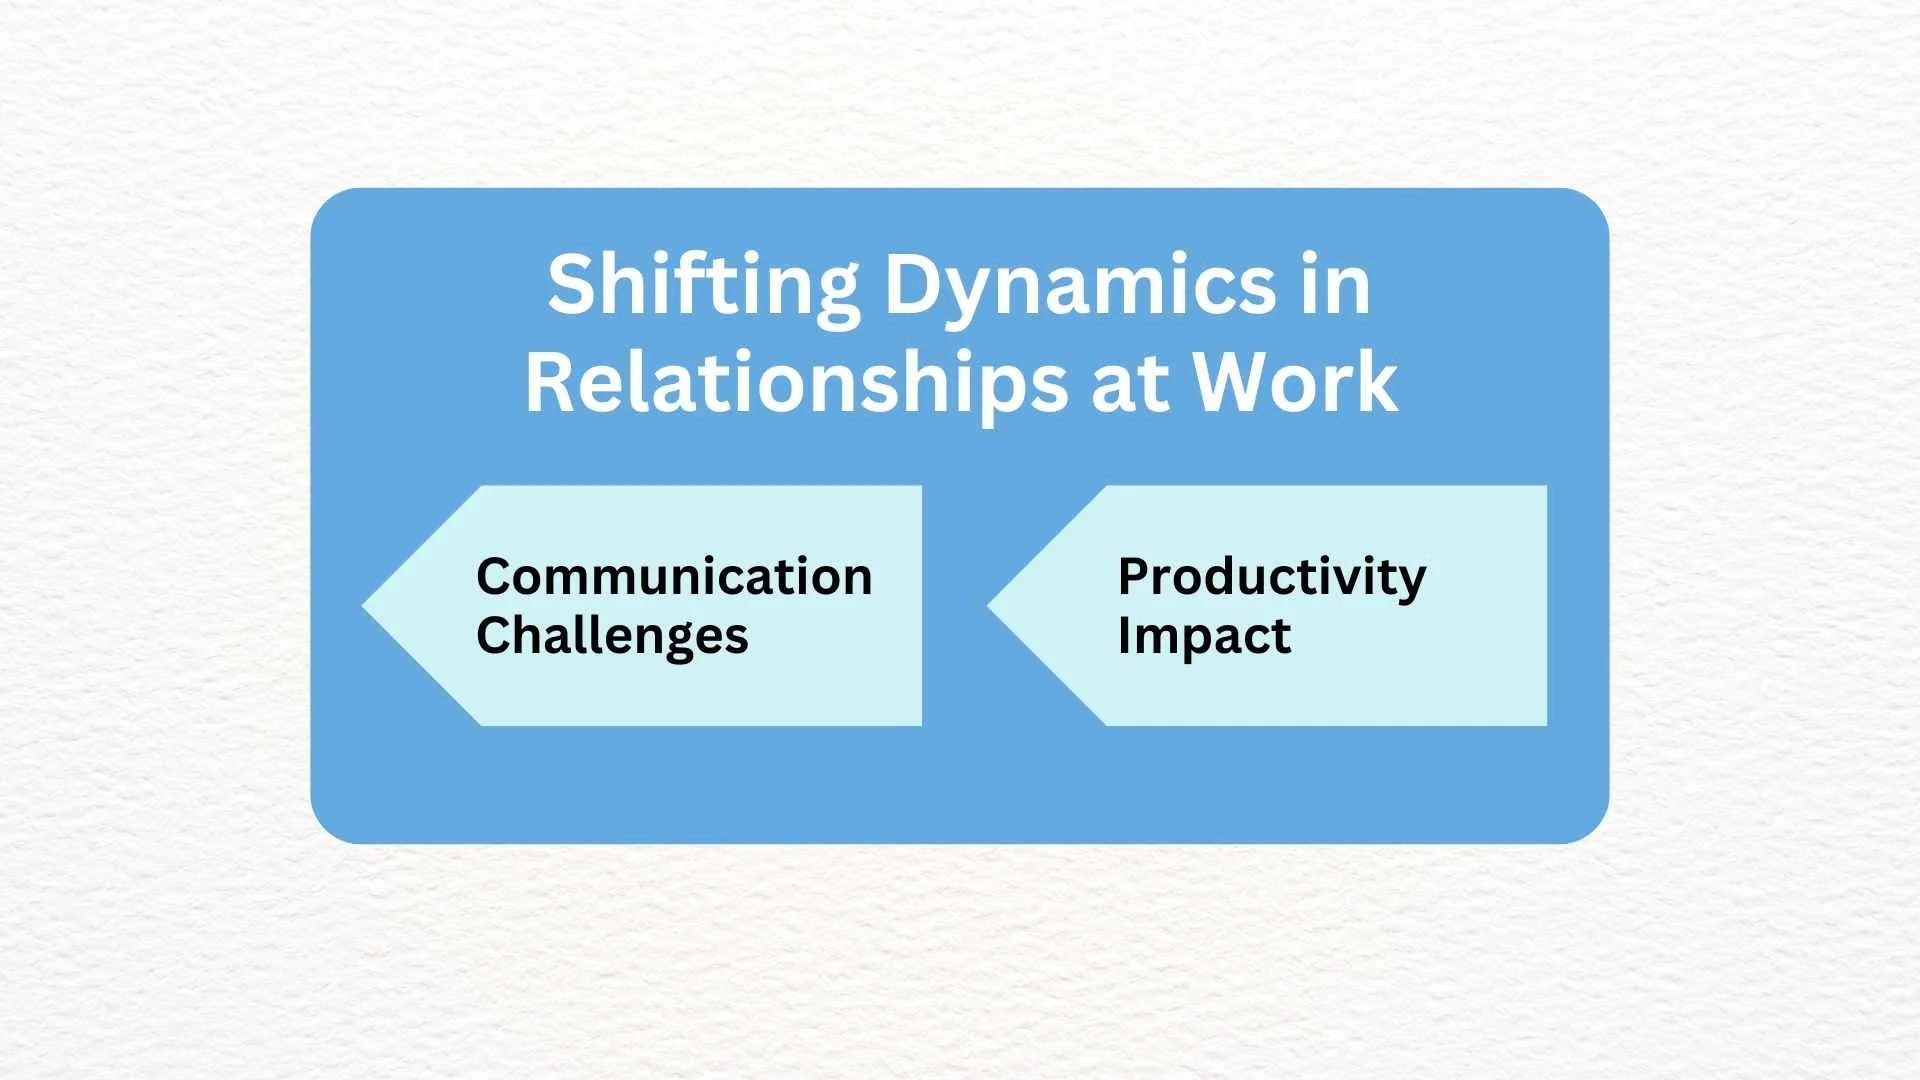
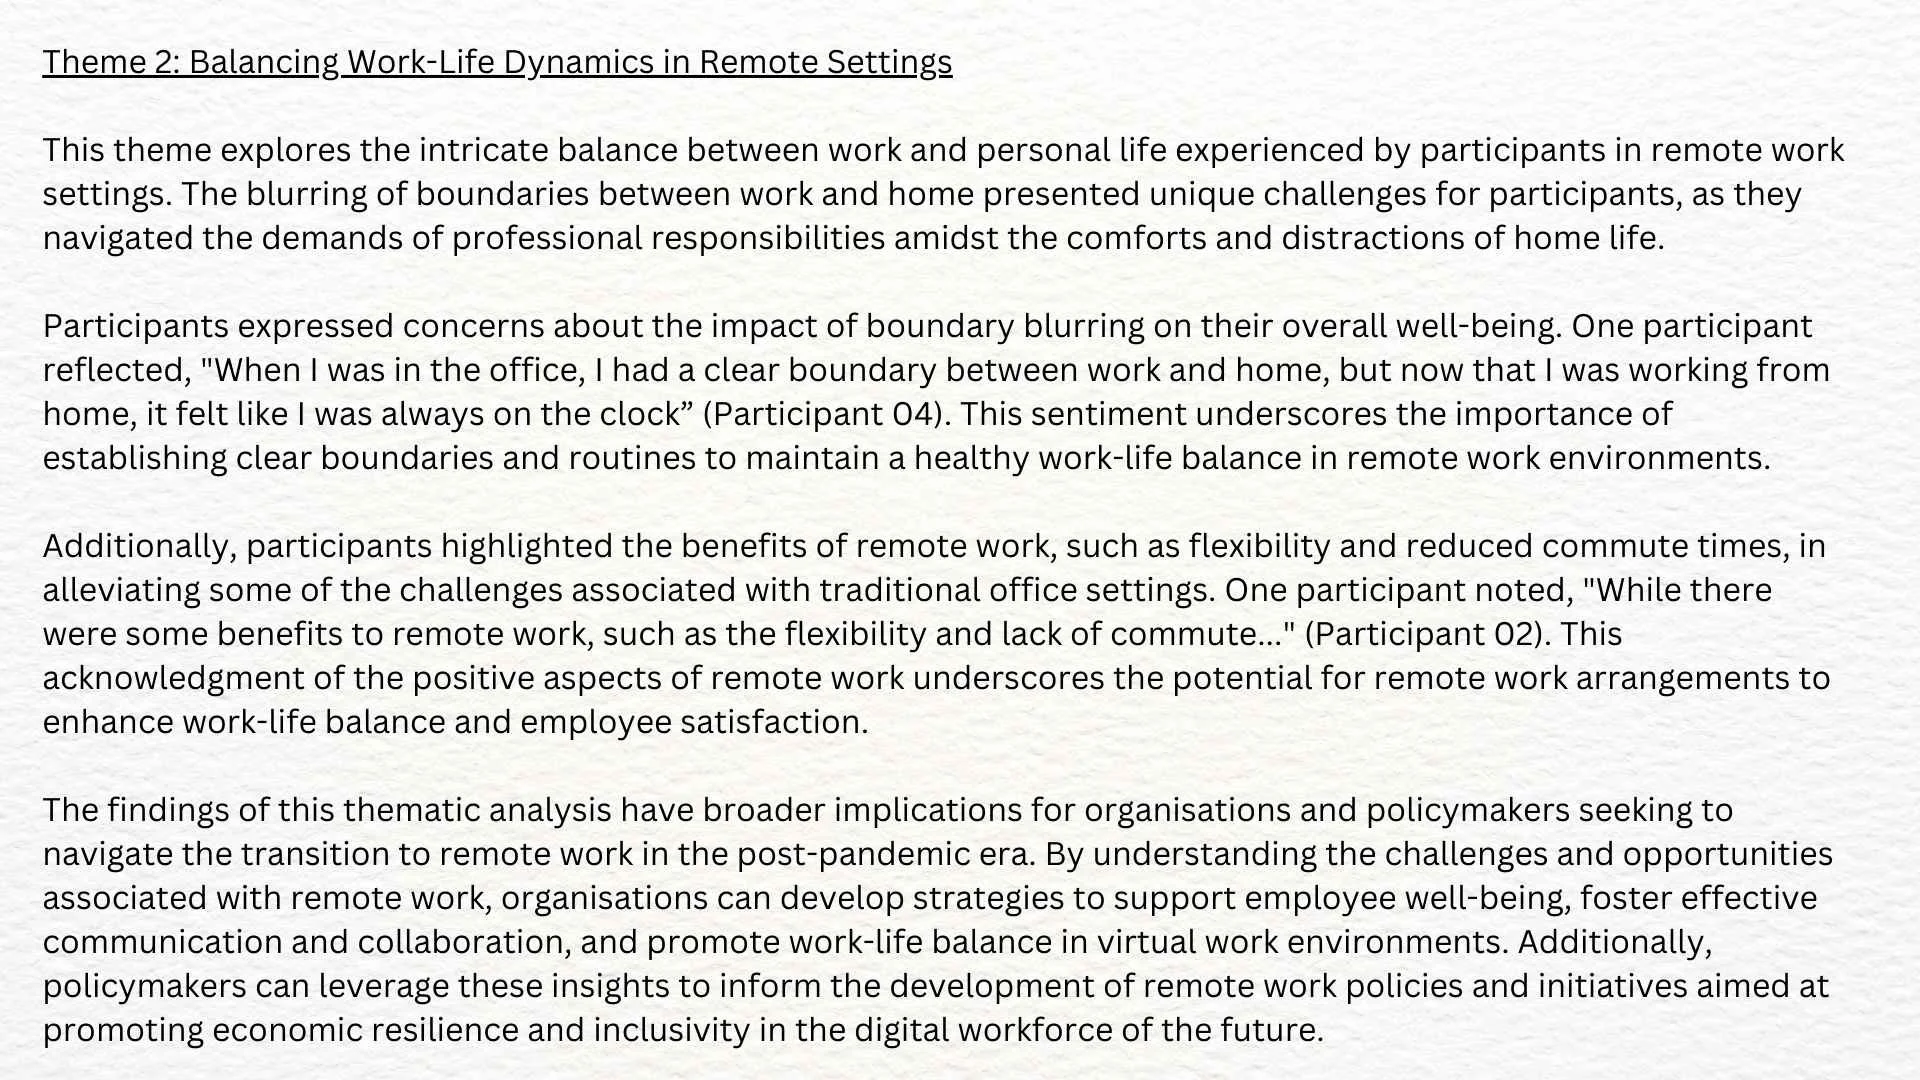
For example, “communication challenges” and “productivity impact” might gather into a broader theme around “shifting dynamics in relationships at work”.
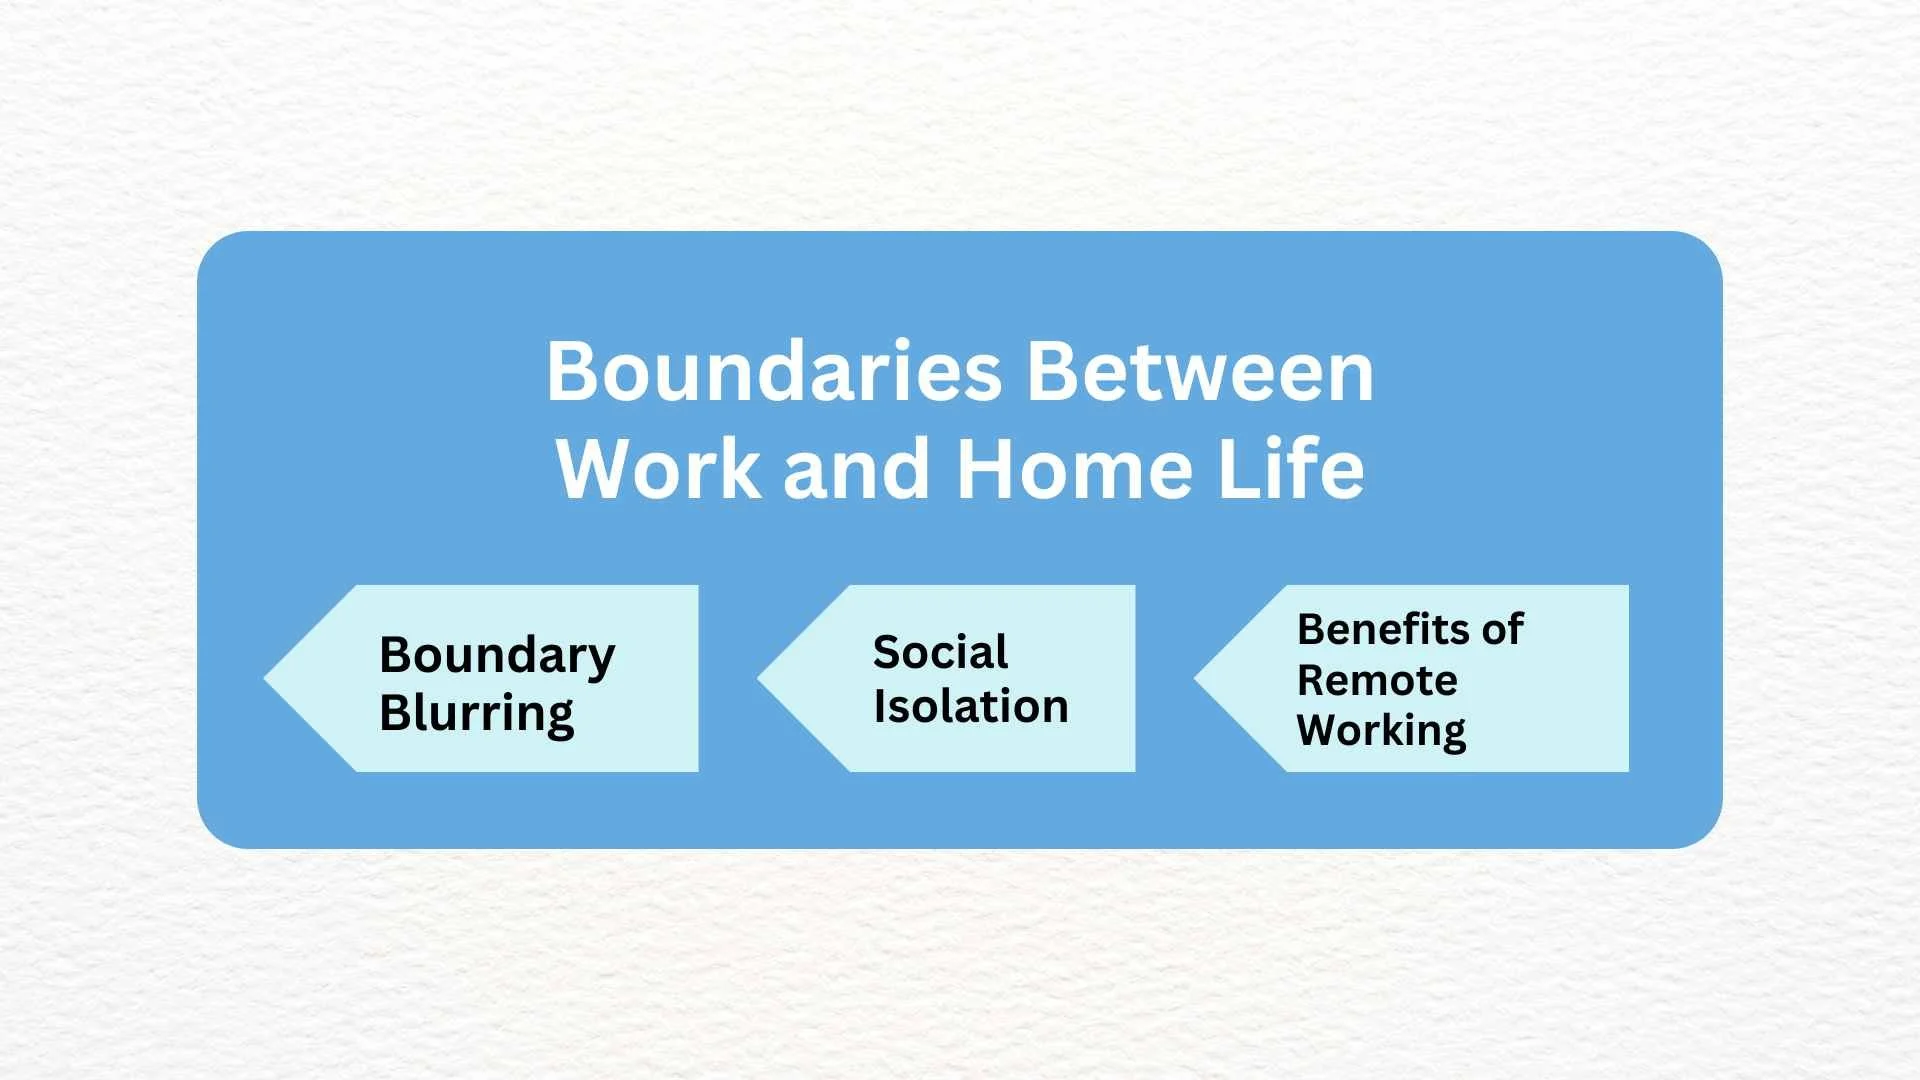
Another example: “boundary blurring”, “social isolation”, and “benefits of remote work” might begin to form a theme around “boundaries between work and home life”.
A theme is not just a topic - it is an organising idea that says something meaningful about your data.
If your themes currently feel like headings rather than insights, you are probably still mid-process rather than getting anything fundamentally wrong – so keep going.
If this is the stage you’re stuck in
This is one of the most common pressure points I see. Researchers often understand coding, but feel lost when asked to build themes that are coherent and interpretive.
My free short guide was designed especially for this point in the journey. Get a copy here.

(4) Reviewing themes
Once you have provisional themes, they need testing.
You are asking:
Do these data extracts genuinely belong together?
Is this one theme or three themes wearing the same coat?
Does the overall set of themes tell a coherent story about the data?
This stage often involves movement – things will change. Some themes strengthen, others split, some disappear altogether. This is part of the process – not a sign you have been getting anything wrong. You need to go through a messy phase before things get neat again.
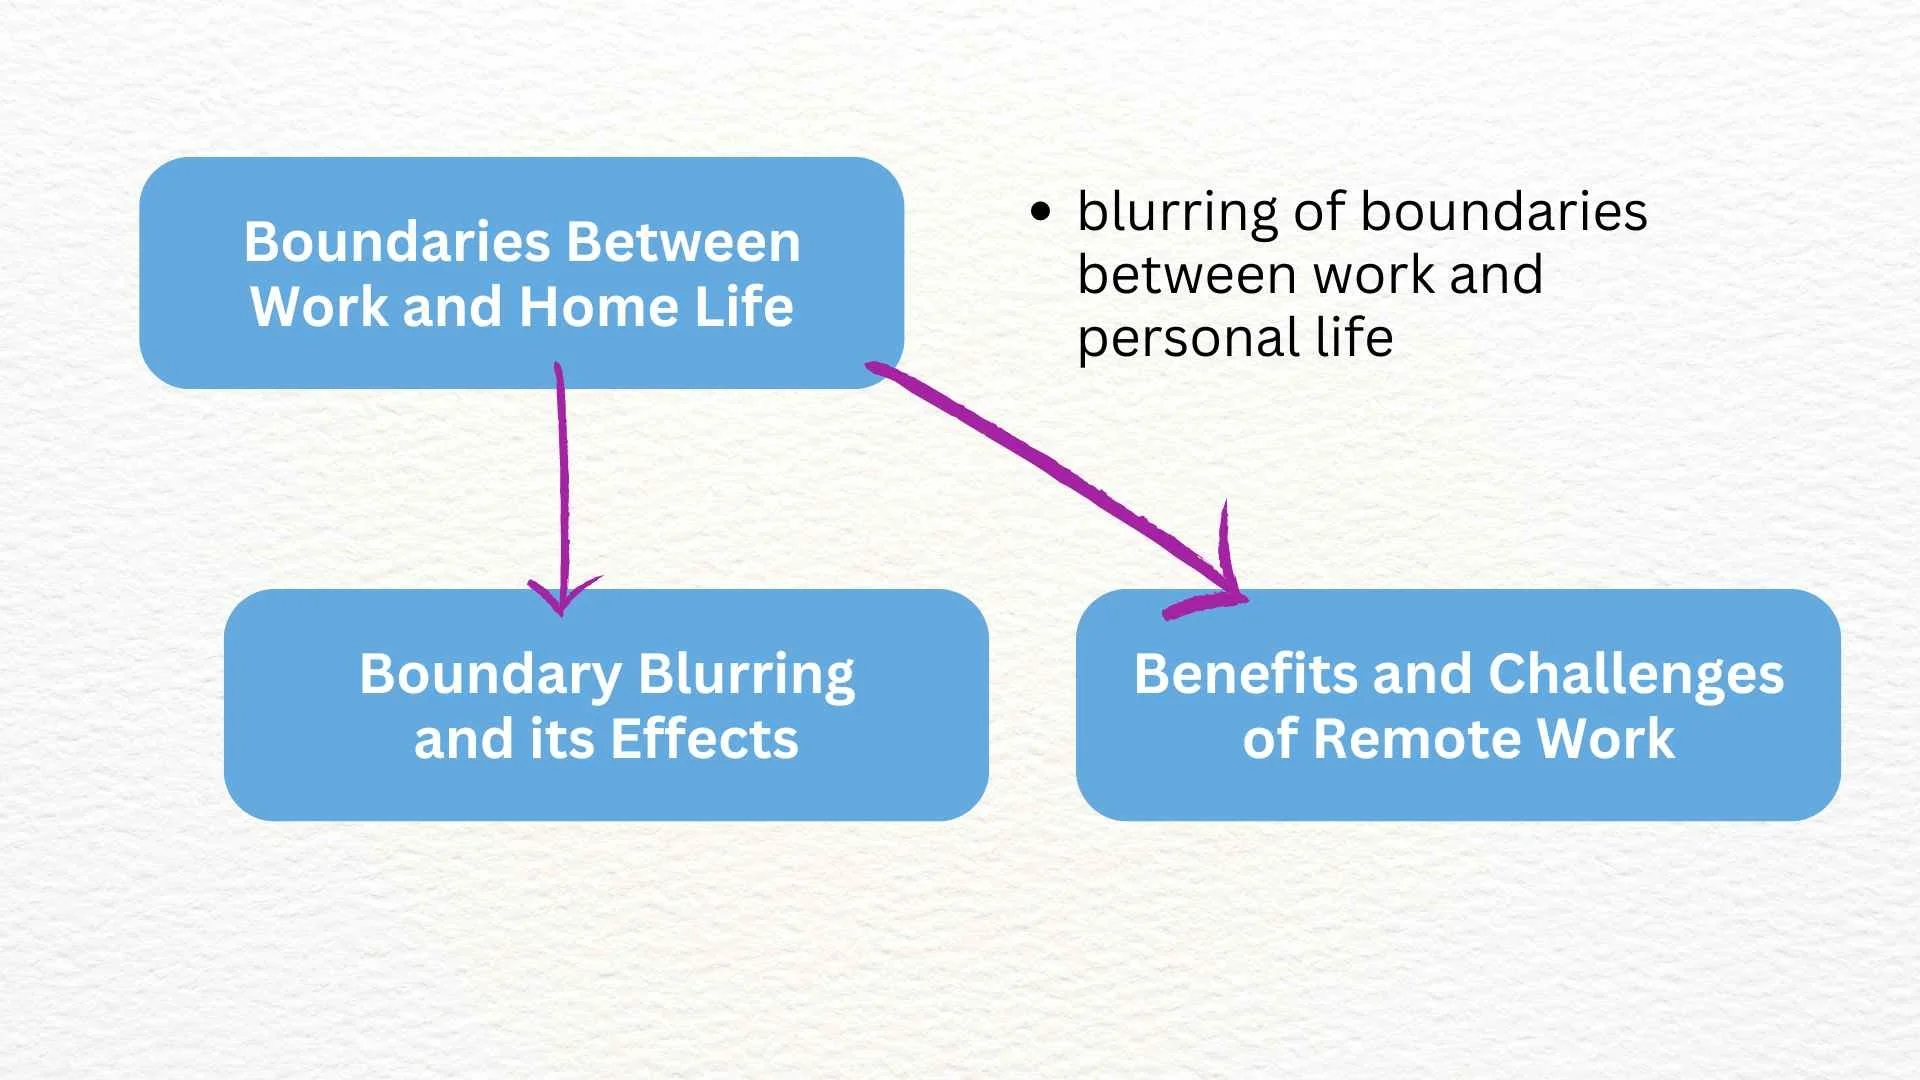
For instance, a broad theme such as “boundaries between work and home life” may be doing too much. On review, you may separate it into, “boundary blurring and its effects”, and “benefits and challenges of remote work”.
Reviewing themes can feel less satisfying than coding because progress is messier. Yet this is where many analyses become sharper and more defensible.
The researchers who get the most out of this stage are the ones who learn to sit with uncertainty for a while and don’t rush to impose structure or order prematurely. This will take time to figure out, so be okay with leaving things unfinished and coming back to them.
(5) Defining and naming themes
A good theme name should capture the central organising idea rather than merely label a topic area.
Compare these theme names: “communication”, “problems with meetings”, “workplace disconnection in remote settings”.
The third option goes further than the first two because it begins to interpret.
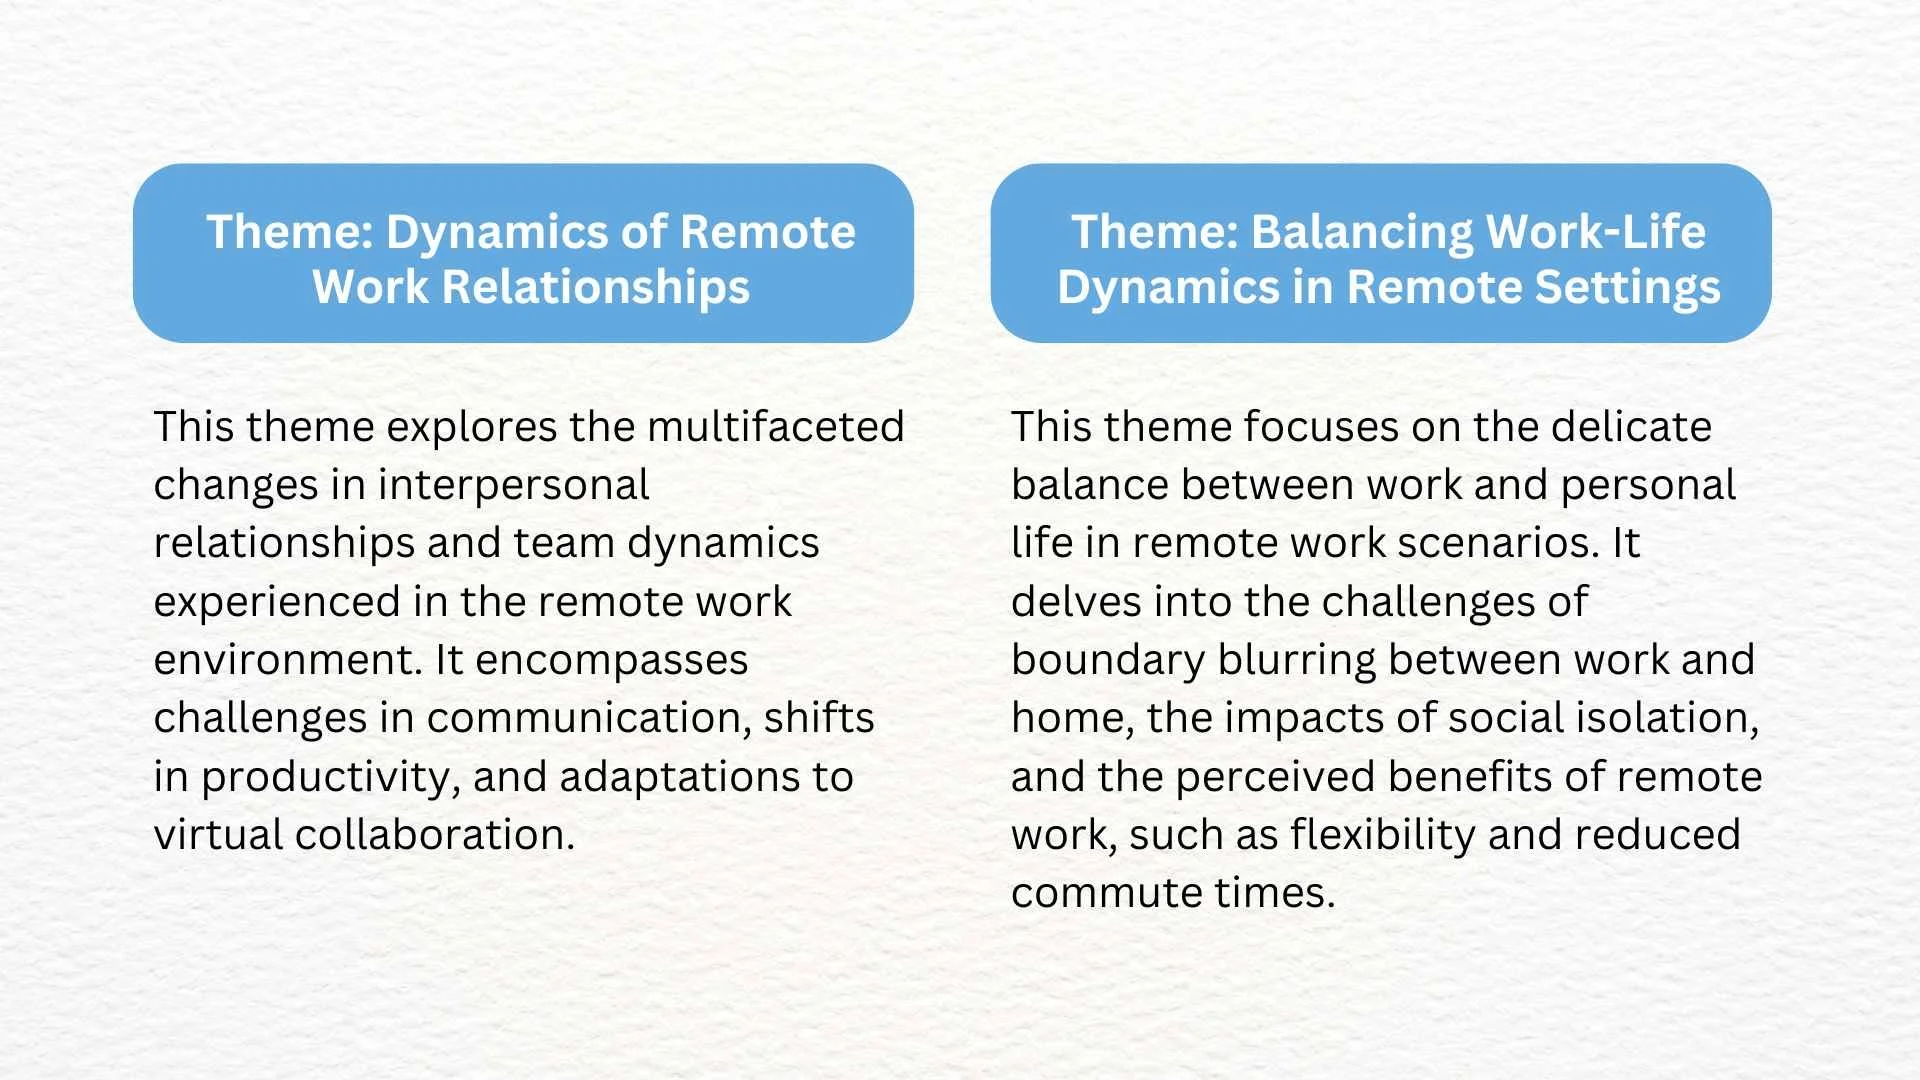
At this stage, it can be helpful to write a short paragraph for each theme:
What is this theme about?
What does it reveal?
How does it relate to the research question?
What sits inside it, and what does not?
Many researchers discover here that a theme still lacks focus. That is useful information. Trying to explain a theme often reveals whether it actually holds together. This is where you’ll start to see that clarity comes through the writing, not before the writing – so the sooner you can start writing about your themes, the sooner you will get clearer on what they are.
(6) Writing up
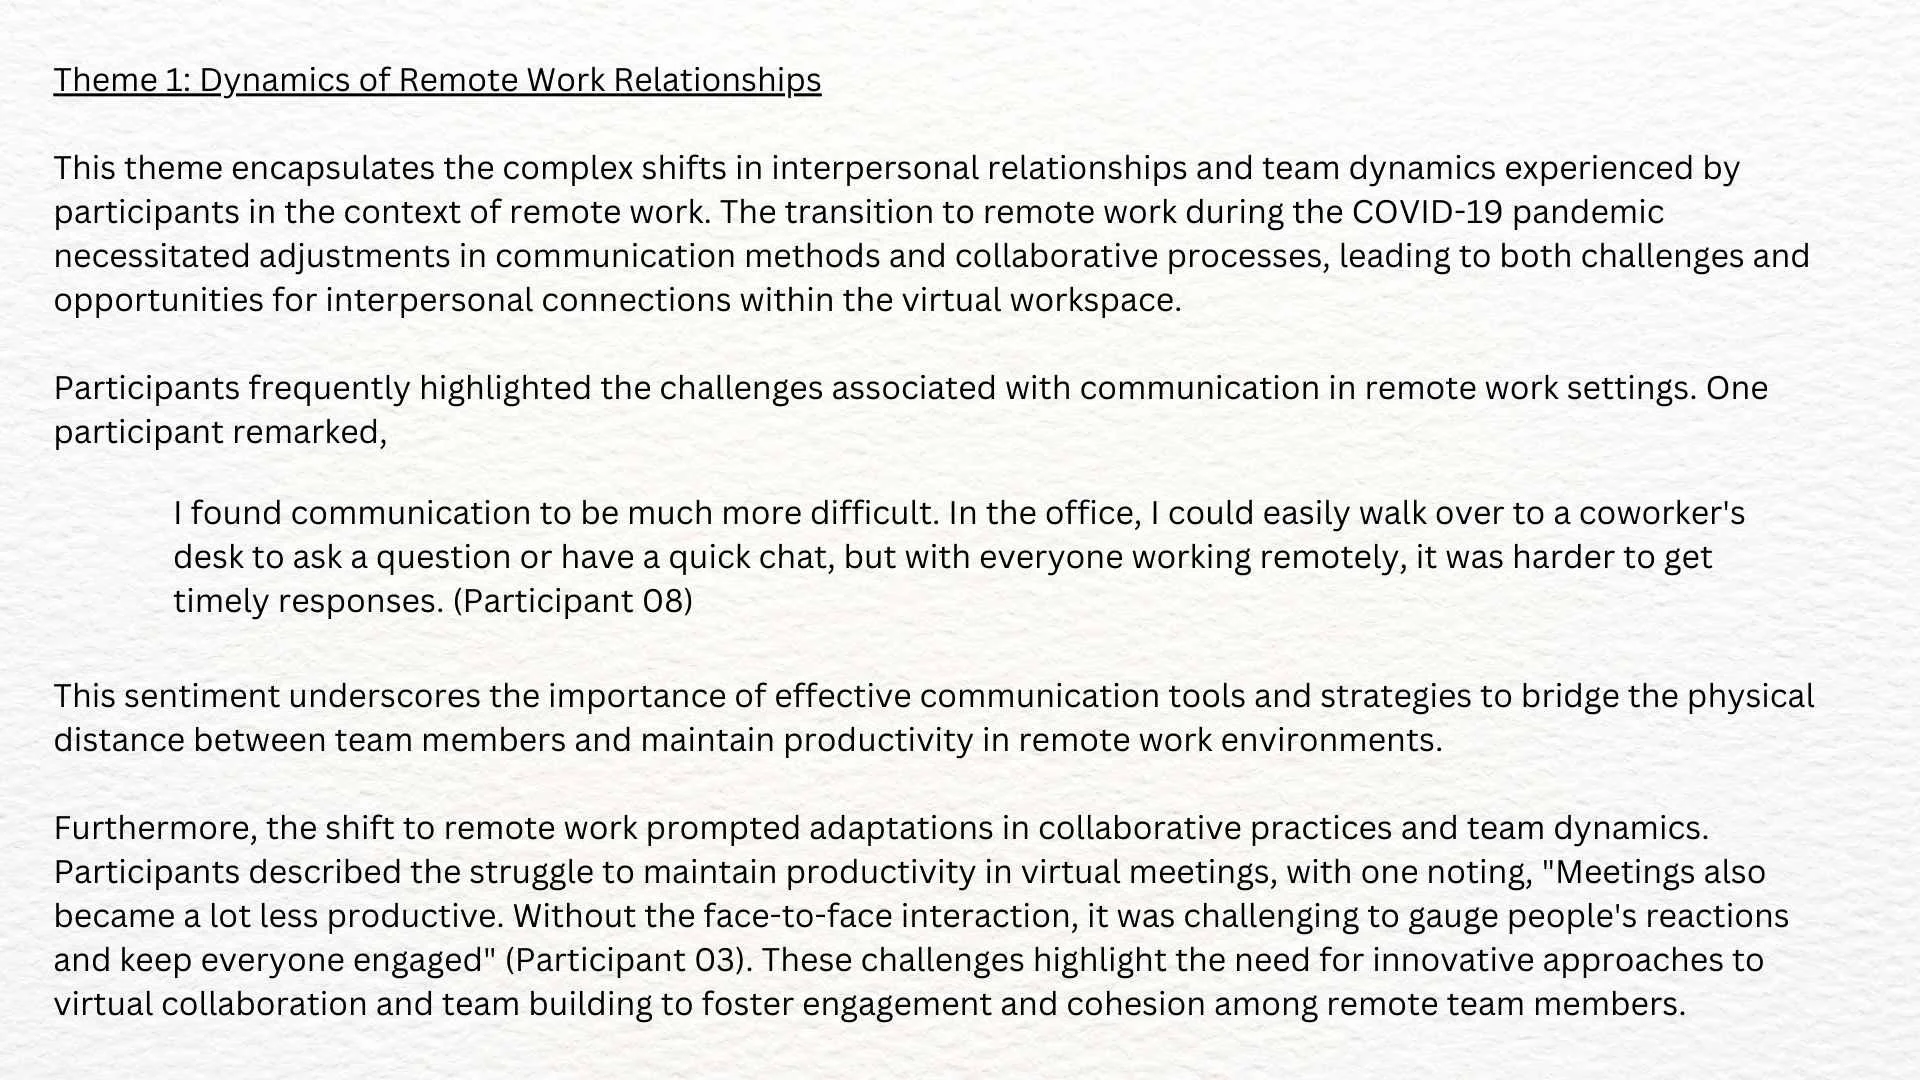
Writing up is where earlier decisions become visible on the page. You are now expected to show what each theme is, how it is grounded in the data, why it matters, how themes answer the research questions, and how your interpretation is reasonable and coherent.
A strong write-up usually combines analytic commentary, carefully chosen extracts, explanation rather than over-quoting, and clear links back to the wider study.
One issue I often see is researchers using too many participant quotes with very little interpretation. Every quote should fulfil a purpose – ask yourself: What is this quote for? What is it doing?
Different disciplines present thematic analysis differently, but the core principle remains the same: make your reasoning visible.
Why Braun and Clarke can feel harder than it looks
The six stages are helpful, but they are not six tidy boxes completed once each.
Most real projects involve revisiting codes, renaming themes, re-reading transcripts, changing your mind, refining claims, and noticing new patterns while writing.
It usually means you are doing analysis – this is what it looks like. In the same way that my nice new bookcase doesn’t tell the story of the messy process that went into its assembly, your write up won’t tell the story of the frustrating journey that got you to your themes. In the write up, it is allowed to look neater than it actually was.
If you’ve read this and thought:
I understand the stages, but I’m still not fully confident in how to do them well
that is an honest and very common place to be.
Many textbooks explain the framework. Fewer explain what it feels like to move through it when the process becomes uncertain, iterative, and interpretive.
That is the gap I’ve spent years helping qualitative researchers navigate.
My step-by-step Braun & Clarke Reflexive Thematic Analysis Guide offers structured support for coding, theme development, interpretation, and writing up - especially at the points where many researchers begin doubting themselves.
It’s here when you need a more grounded way of working.
Feel like you want to throw your analysis away and start again “properly”?
This is exactly where most people get stuck with Braun & Clarke’s thematic analysis.
Not sure if you’ve coded things “right”?
Worried your themes don’t quite make sense (or feel forced)?
Reading papers over and over and still thinking, “I don’t get it…”
That doesn’t mean you’ve done it wrong - it usually means you’ve hit the messy middle
This guide shows you how to make sense of what you’ve already done and move forward with confidence, without starting from scratch.
Inside, you’ll find a clear, step-by-step breakdown of Braun & Clarke’s six-stage process, with practical examples and worksheets to help you actually do your analysis, not just read about it.
Swipe through the images to see exactly what’s included.
Got questions? Contact me using this form, I’ll be happy to help.
By purchasing this product, you agree to our Terms & Conditions.